Timothy Pesi is the founder of Visual Data Insights in Nairobi, with more than 190 workbooks on Tableau Public. A self-described "Tableau Fanatic and Data Lover", he uses data to make sense of the stories shaping Kenya, Africa and the wider world.
His work in data
Timothy works across data science, data engineering and data visualisation, and his interests extend to UI and UX, combining Figma with Tableau. On GitHub, he describes himself as a Python developer, data scientist, machine learning engineer and team lead, and his projects there range from recreating charts from the book Storytelling with Data in Python to automating data transfers to Redshift.
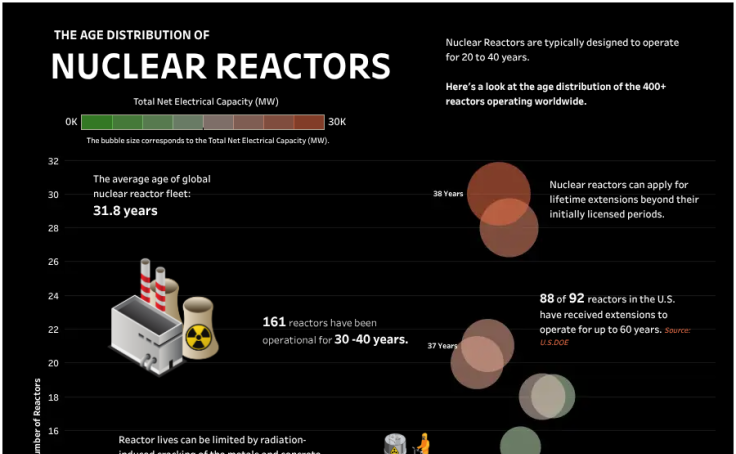
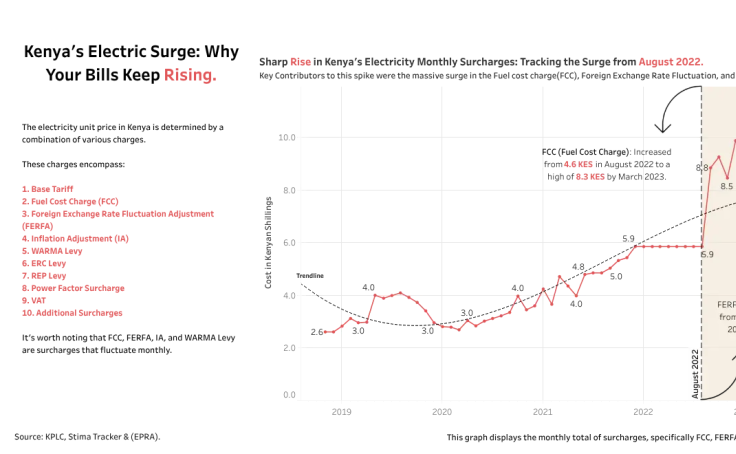
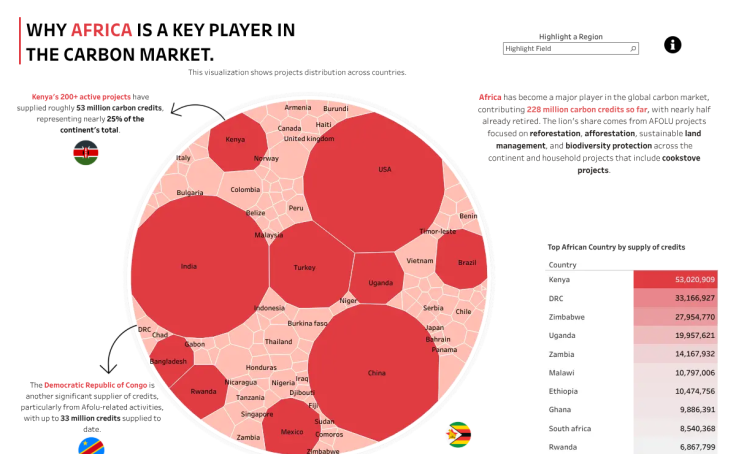
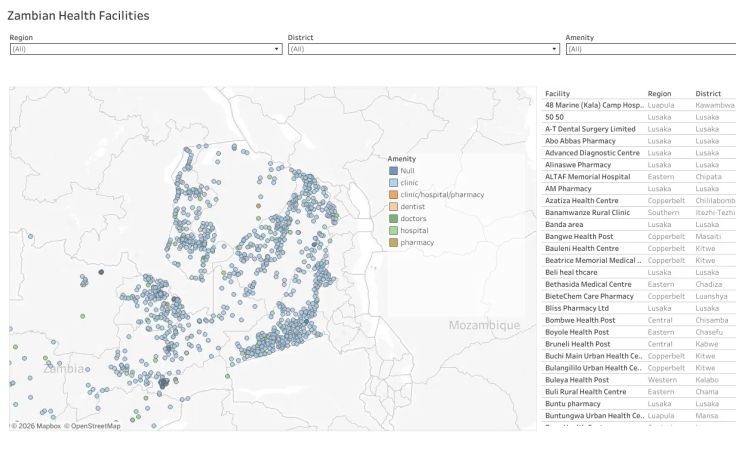
His Tableau work keeps coming back to questions that affect daily life: why Kenyan electricity bills keep rising, where Africa fits in the carbon market and how healthcare facilities are spread across Zambia. His "How Old Are the World's Nuclear Reactors?" was selected as a Community Pick in the Kenya TUG viz gallery.
Visual Data Insights
Published as VDI Global, Visual Data Insights is a Nairobi-based platform that sets out to make complex data easier to see, understand and discover. Recent stories ask how many units of electricity KSh 5,000 actually buys, why turnout has fallen in Kenyan elections, how open county budgets really are and what is driving the rally on the Nairobi Securities Exchange.
He was a guest speaker at the very first Kenya TUG event in October 2025, sharing his journey building a data-focused business and the possibilities that open up when a community of practitioners supports one another.